Usage Statistics
The Usage Statistics tab gives administrators two views of platform activity, split across tabs:
- Operational Metrics — a Sentry-powered dashboard of activity, performance and errors. Answers "is the platform healthy?"
- AI Usage & Cost — token consumption and estimated spend per user, model and operation. Answers "what is it costing, and who is driving that?"
Accessing the Dashboard
Open Settings, scroll to the System section in the sidebar, and click Usage Statistics. You'll need the system_settings.manage permission to see this tab.
AI Usage & Cost
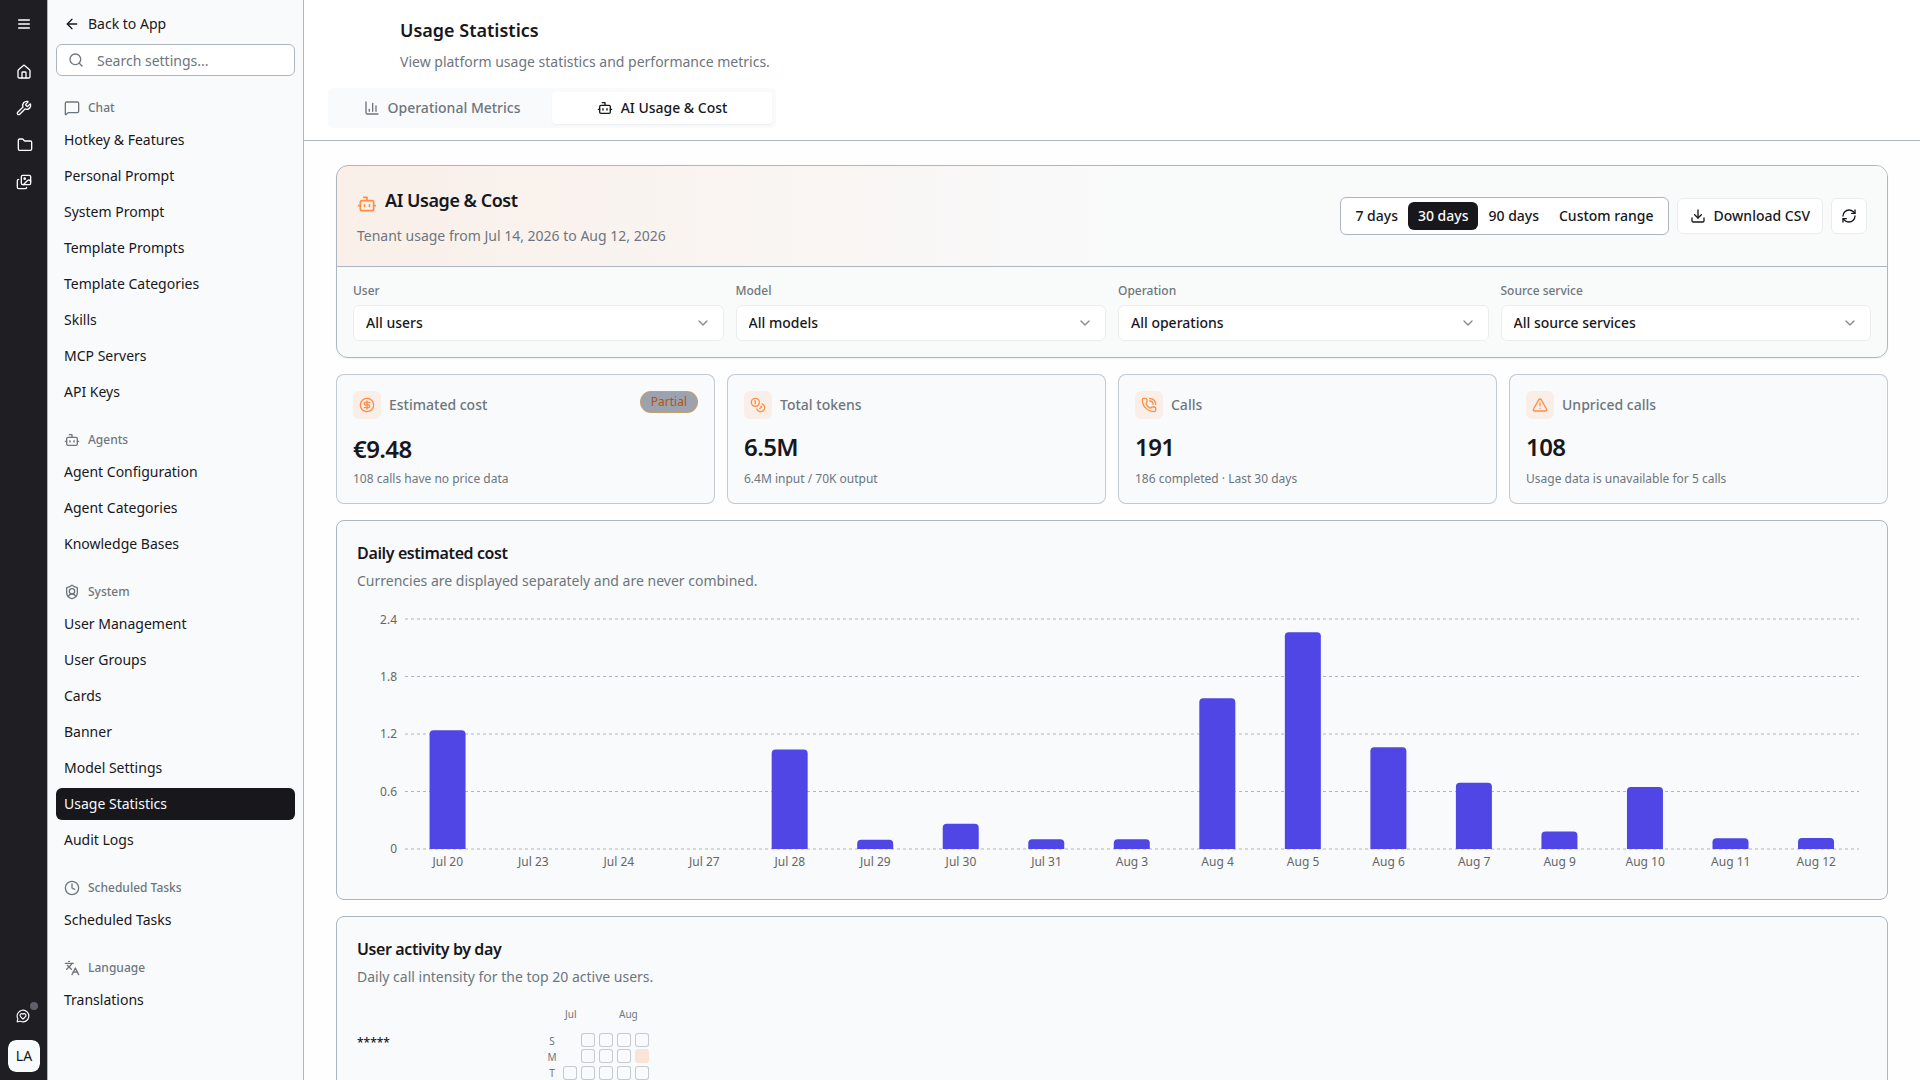
The AI Usage & Cost tab reports token usage and estimated cost for the tenant, filterable by period, user, model, operation and source service, with CSV export.
It is documented in full — including how to read the Partial and Unpriced calls indicators — under Cost Monitoring.
Operational Metrics
The rest of this page describes the Operational Metrics tab.
What's Shown
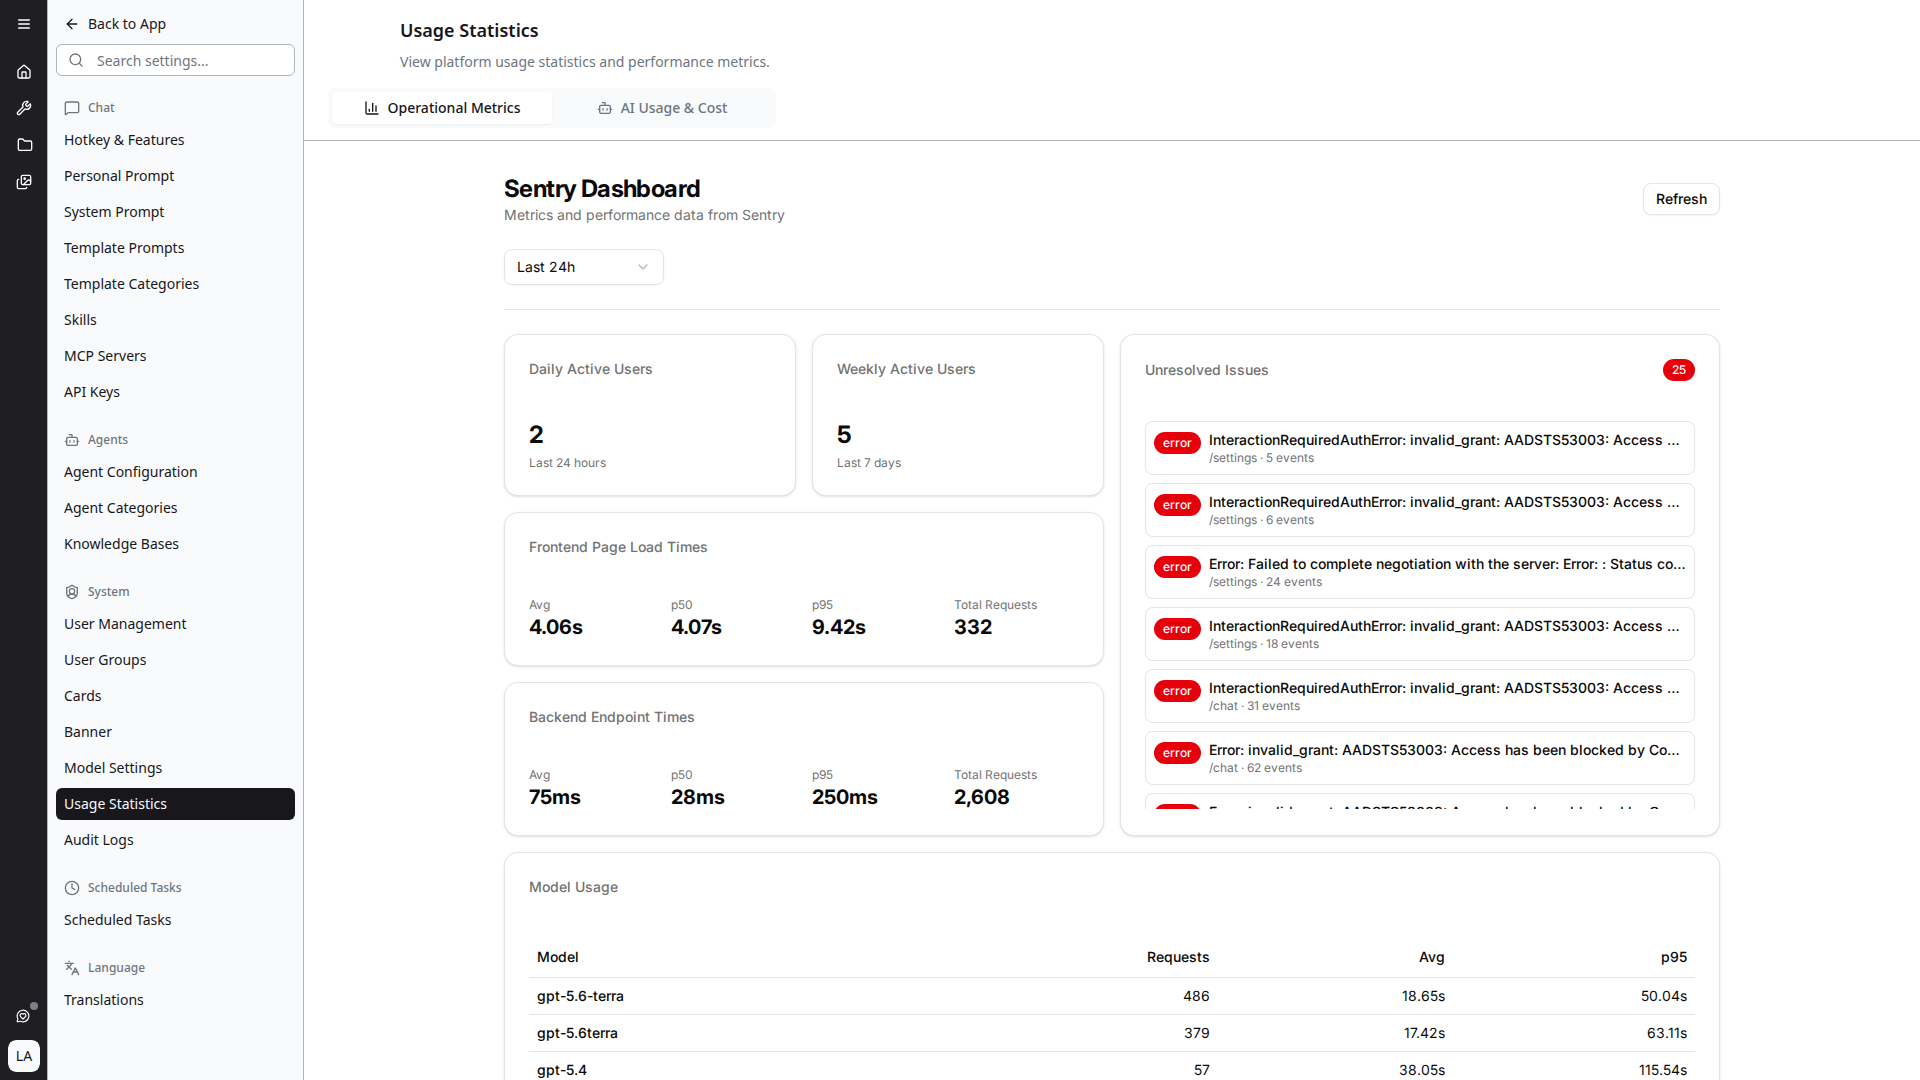
The dashboard is a single page titled Sentry Dashboard — "Metrics and performance data from Sentry". A time range selector at the top (default Last 24h) controls the period for every metric, and a Refresh button reloads on demand.
Active Users
Two count cards:
- Daily Active Users — number of unique users active in the last 24 hours
- Weekly Active Users — number active in the last 7 days
Frontend Page Load Times
Aggregate frontend performance:
- Avg — mean page load time
- p50 — median
- p95 — 95th percentile (the slow tail)
- Total Requests — count over the selected period
Backend Endpoint Times
The same Avg / p50 / p95 / Total Requests breakdown for backend API calls.
Unresolved Issues
A live feed of errors captured by Sentry, with the count badge in the top-right of the card. Each entry shows the error class, message preview, the route it occurred on, and event count. Click an entry to open it in Sentry for the full stack trace.
Model Usage
A table of LLM models used over the period, with per-model Requests, Avg latency, and p95 latency. Useful for spotting models that are over- or under-used, and for identifying which models are dragging on latency.
Configuration
The dashboard is rendered as an embedded view inside the platform. If you see a "Statistics not configured" message, the deployment is missing the lizzy_stats_url setting and an administrator with infrastructure access needs to point the deployment config at a running Sentry-backed stats backend.
The platform automatically passes the current UI theme to the embedded dashboard so it matches light or dark mode.
Related
- Cost Monitoring — token spend and provider costs (separate from the Sentry dashboard above)
- Audit Logging — change history across the platform
- User Management — manage who has access