Cost Monitoring
4C:me Safe AI Platform tracks token usage and estimated cost itself, per request, per user and per conversation. That in-platform view is the fastest way to answer "who is spending what," and it is complemented by the Azure-side tooling for authoritative billing.
There are three complementary views:
- AI Usage & Cost (in-platform) — token spend and estimated cost attributed to users, models and operations. Best for chargeback, spotting heavy usage, and answering questions about specific users.
- Token Usage (Azure AI Foundry) — requests, prompt tokens, completion tokens and latency per model deployment. Best for usage patterns over time.
- Cost Analysis (Azure Cost Management) — actual invoiced spend broken down by model tier and token meter. Best for budgeting and reconciliation.
AI Usage & Cost
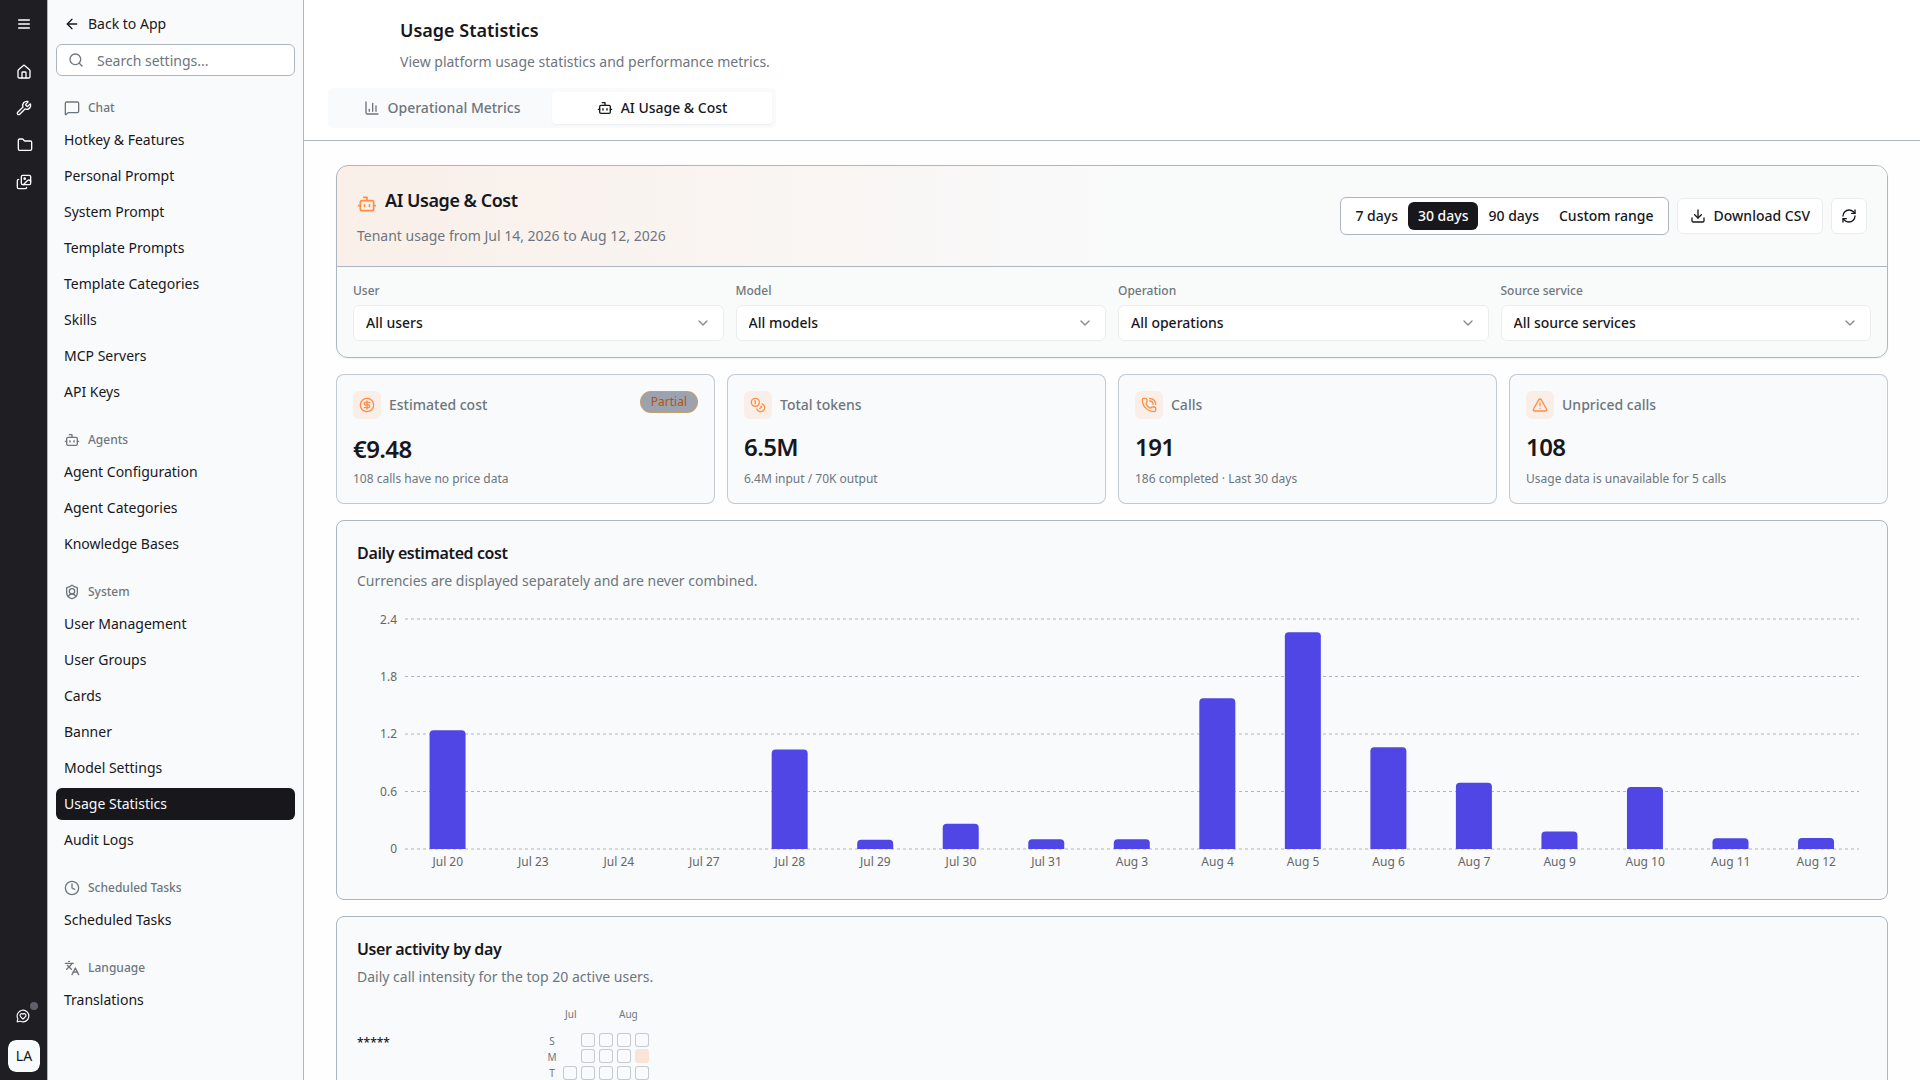
Open Settings → Usage Statistics and select the AI Usage & Cost tab. The header states the tenant and period being reported, for example "Tenant usage from Jul 14, 2026 to Aug 12, 2026."
Period and filters
- 7 days / 30 days / 90 days / Custom range — the reporting period
- User — narrow to a single user, or All users
- Model — narrow to a single model, or All models
- Operation — narrow by operation type
- Source service — narrow by the service that made the call (chat, scheduled tasks, and so on)
- Download CSV — export the filtered data
Headline figures
- Estimated cost — total estimated spend for the period, in the configured currency
- Total tokens — with the input/output split
- Calls — how many requests were made, and how many completed
- Unpriced calls — calls the platform could not price
Charts
- Daily estimated cost — spend per day. Currencies are displayed separately and are never combined.
- User activity by day — a heatmap of daily call intensity for the most active users
Reading "Estimated" and "Partial" honestly
The cost figure is an estimate, and the dashboard says so. When some calls in the period have no price data, the Estimated cost tile is flagged Partial and reports how many calls were unpriced ("N calls have no price data").
Unpriced calls arise when a model has no metered unit rate configured. Because those calls are excluded from the total rather than guessed at, a Partial figure is a lower bound on real spend.
To price a model's usage, set its metered unit rates in Model Settings. Invalid rates are rejected rather than silently stored, so a model either has usable rates or reports as unpriced.
Use Azure Cost Management for figures that must reconcile with an invoice.
Showing or Hiding Costs from Users
Users can see the token usage and estimated cost of their own conversations directly in 4C:me. Some organisations would rather not surface money to end users.
An administrator setting controls this: with it enabled, estimated costs are hidden in user conversations while remaining visible to administrators here. Token counts and the admin dashboard are unaffected.
Token Usage in Azure AI Foundry
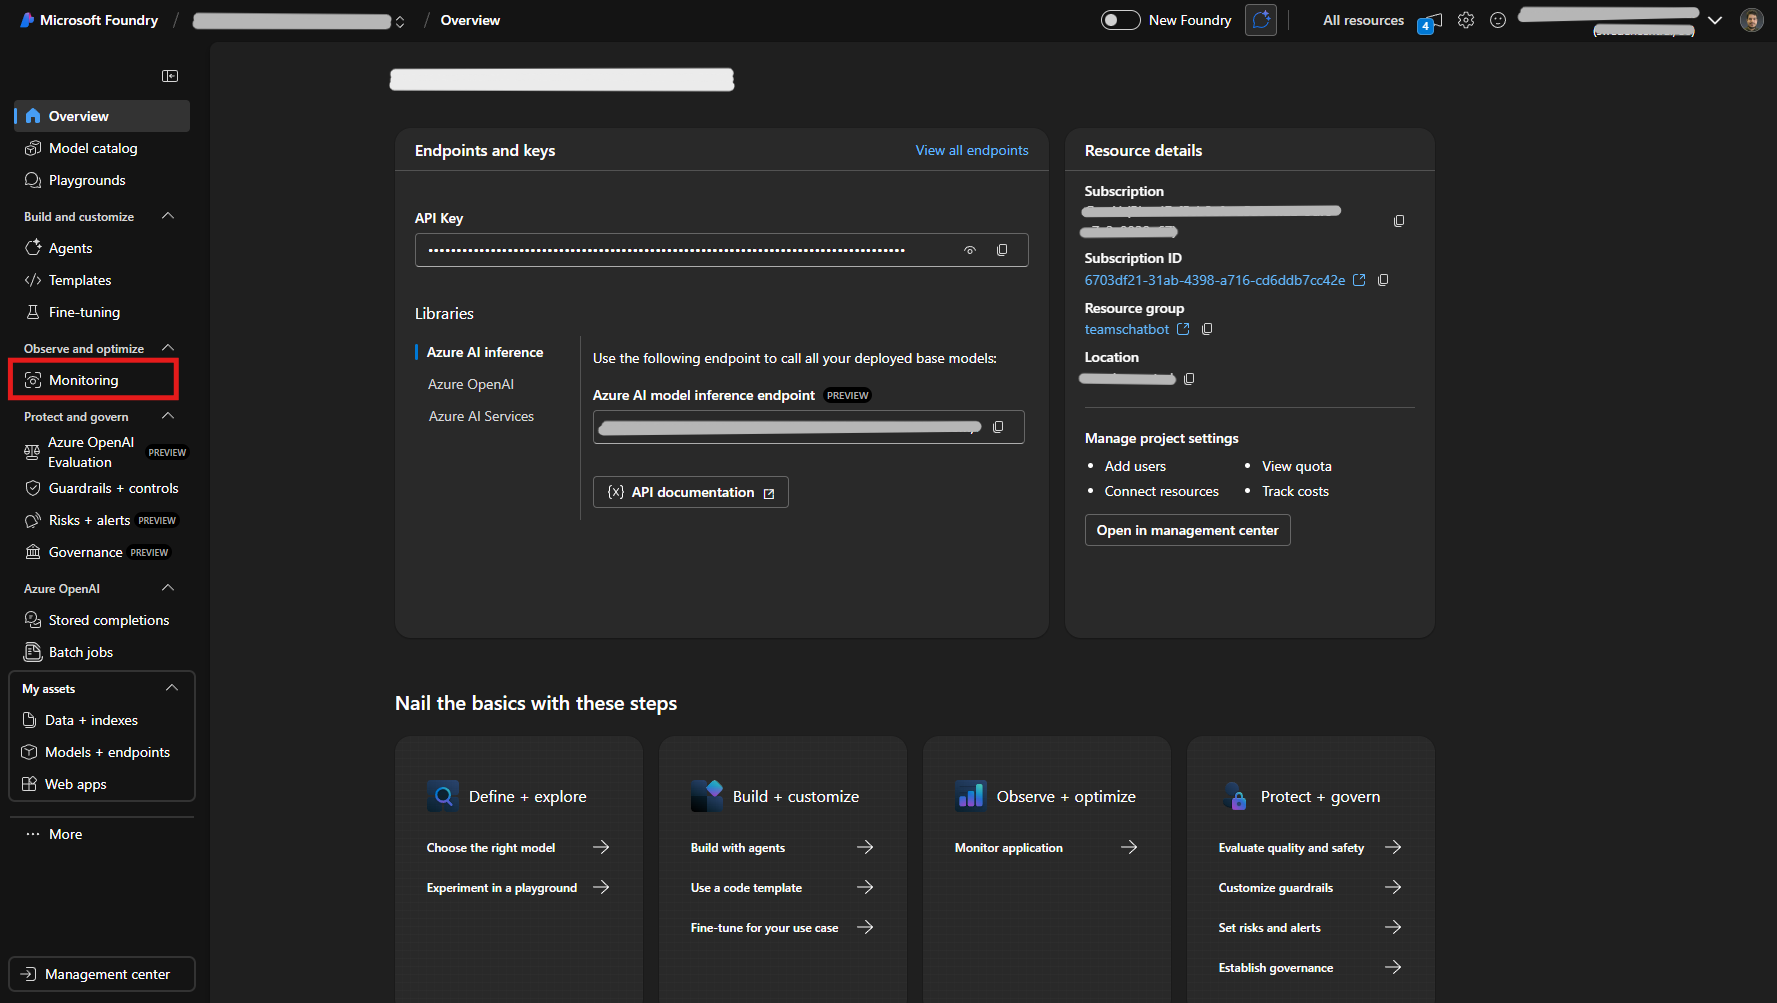
- Go to ai.azure.com and open your AI Foundry project
- In the left sidebar, expand Observe and optimize
- Click Monitoring
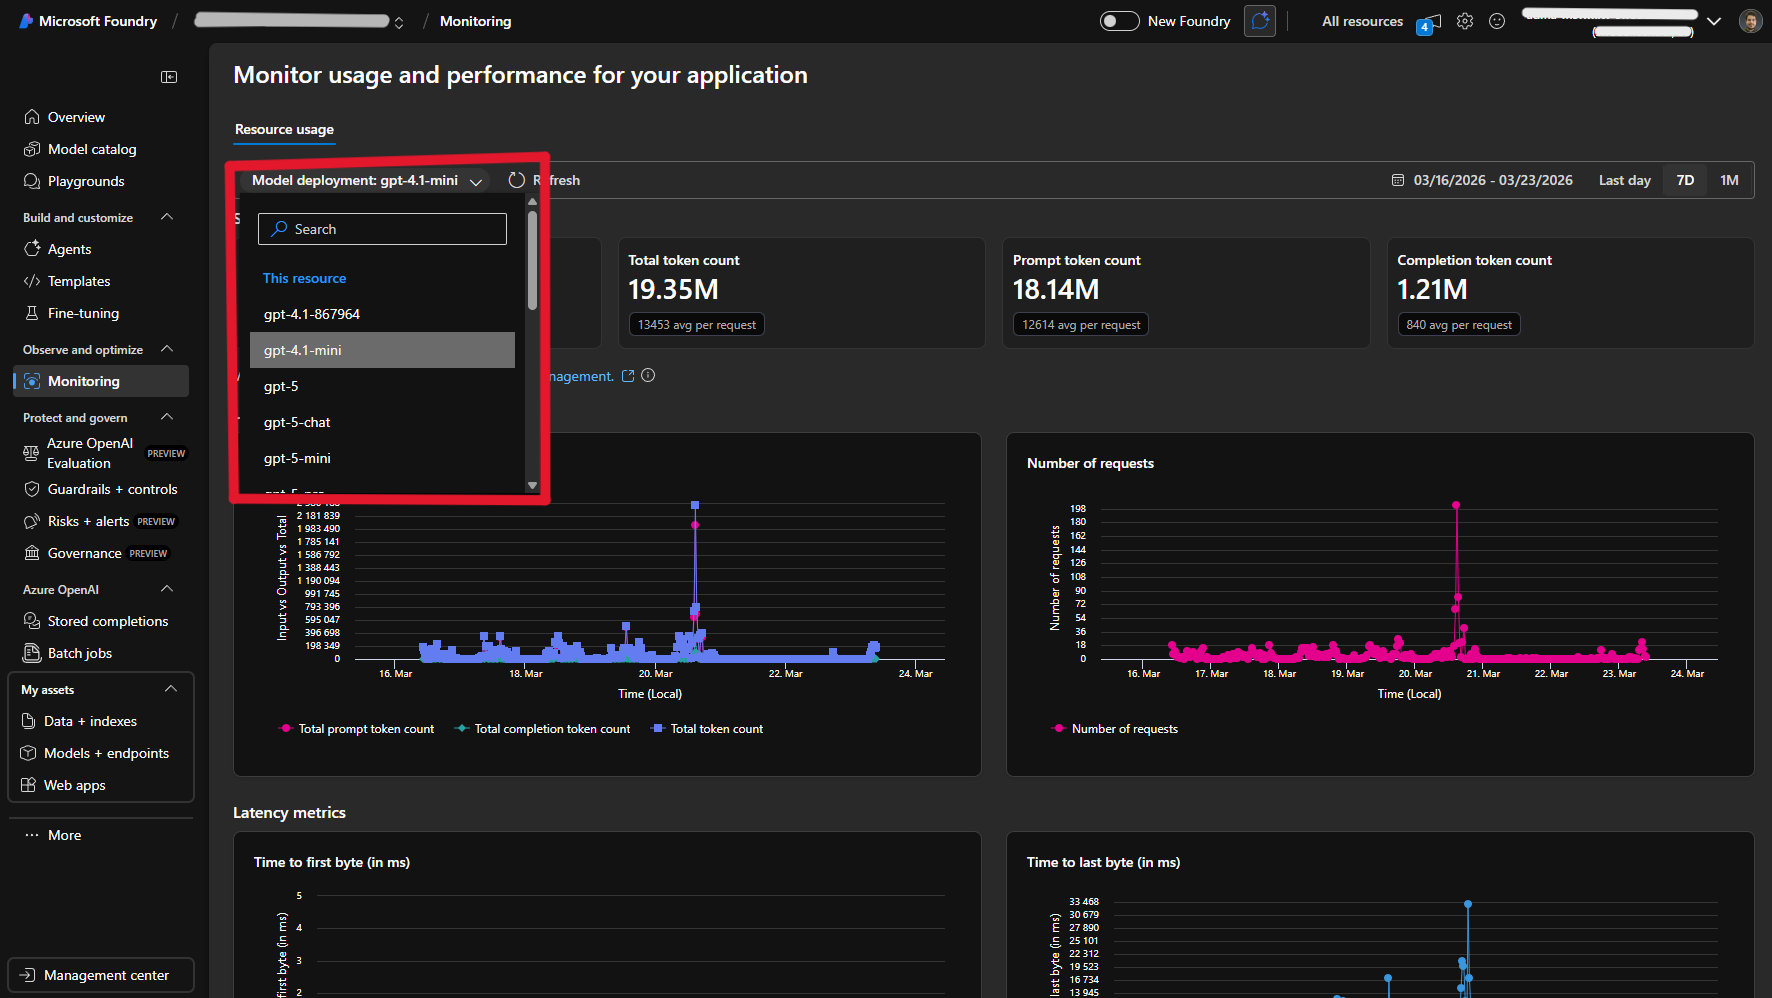
The Monitoring page provides key metrics for each model deployment:
- Total Requests — Number of API calls
- Total Token Count — All tokens consumed
- Prompt Tokens — Input tokens sent
- Completion Tokens — Output tokens generated
Additionally, you can view charts for input vs. output tokens over time, number of requests over time, and latency metrics (time to first byte and time to last byte).
Use the date range picker (top-right) to view the last day, 7 days, or 1 month of data. Use the Model deployment dropdown at the top of the page to switch between deployments.
Checking Costs via Azure Cost Management
To see actual costs broken down by model and token type:
- From the Monitoring page, click the Azure Cost Management link
- Alternatively, go to portal.azure.com and navigate to Cost Management + Billing
- Filter by your Cognitive Services resource
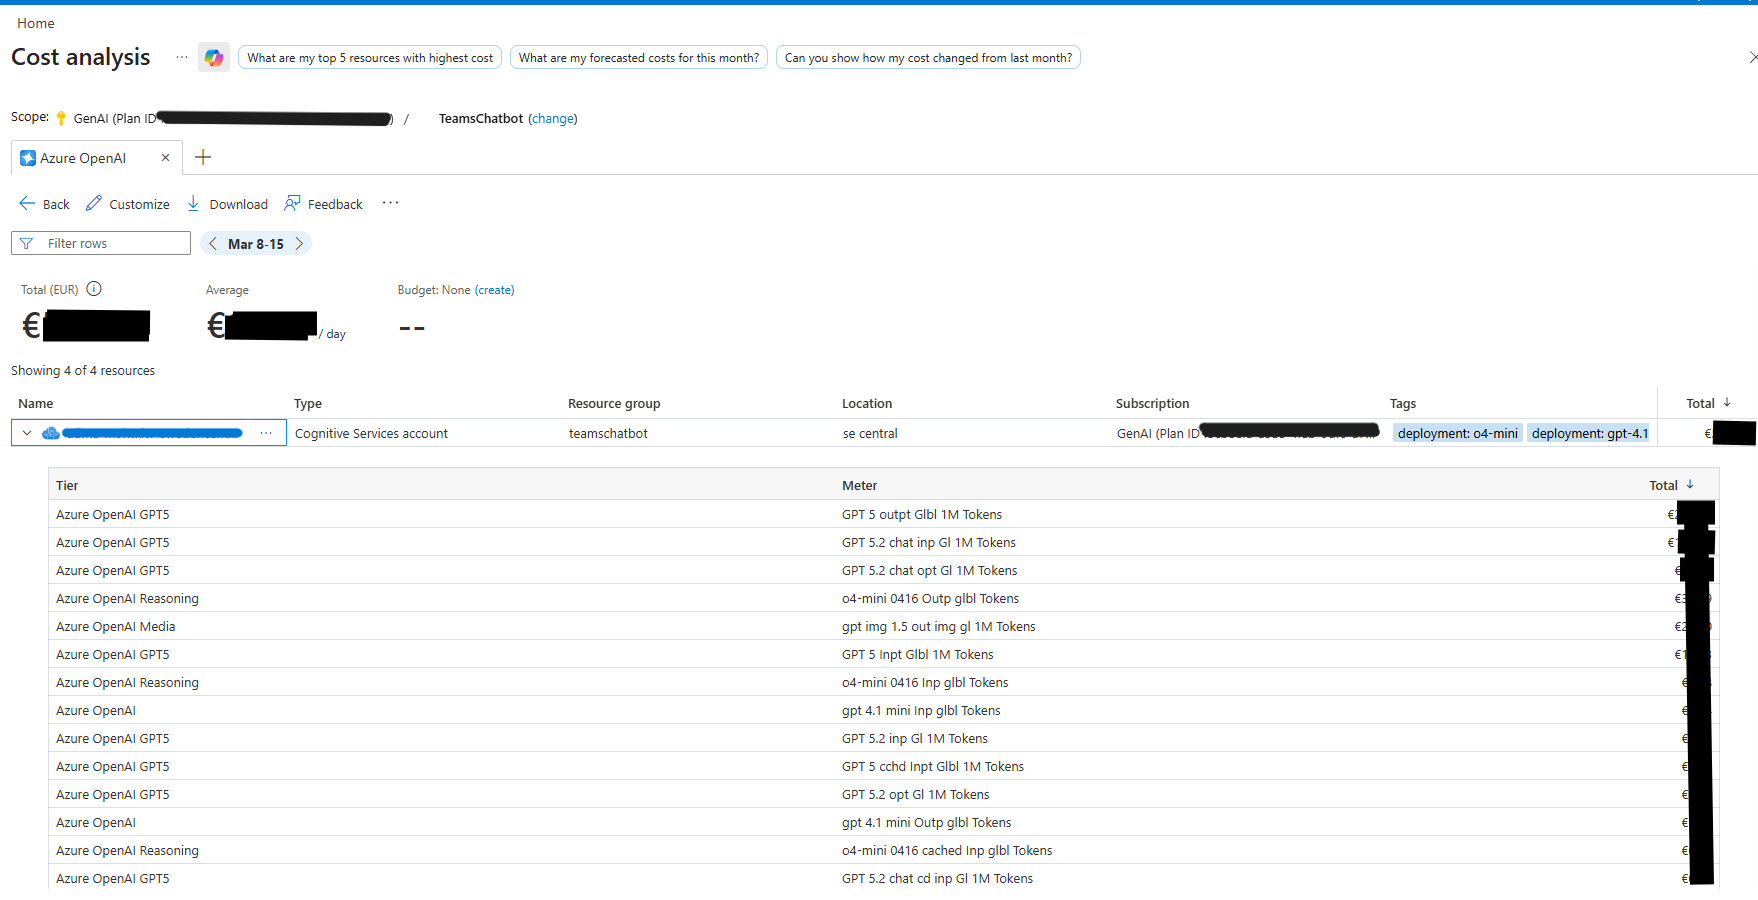
The cost breakdown shows:
- Total cost in EUR (or your configured currency)
- Average daily spend
- Cost per model tier (e.g. GPT5, Reasoning, Media)
- Cost per token meter (input, output, cached, chat)
- Date range filtering for custom periods
Tips
- Attribute before you optimise — start from AI Usage & Cost filtered by user and model. It tells you where spend is concentrated; the Azure views tell you how much in absolute terms.
- Chase unpriced calls — a persistently high Unpriced calls count means a model is missing rates, and your estimate is understating real spend.
- Compare models — use the deployment dropdown on the Monitoring page to switch between models and compare their usage patterns.
- Optimize spend — track prompt vs. completion tokens. If prompt token counts are disproportionately high, consider reducing prompt size to lower costs.